

Then and now
Where it stood in 2025, and where it stands today.
The first version of this page was written in summer 2025. Its headline numbers came from two Search Console screenshots, and we have kept both. They are the “then”. Nothing about them has been redrawn.
Figure 1
Then: the last 28 days, as captured in summer 2025
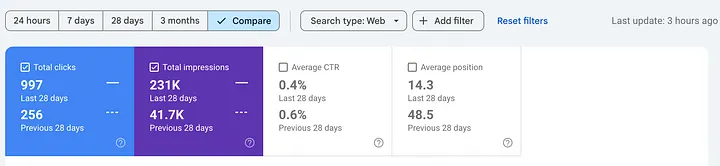
- 1997 clicks in 28 days, up from 256 in the 28 days before.
- 2231K impressions, up from 41.7K.
- 3Average position 14.3, from 48.5.
Figure 2
Then: 1 to 14 July 2025, against the two weeks before
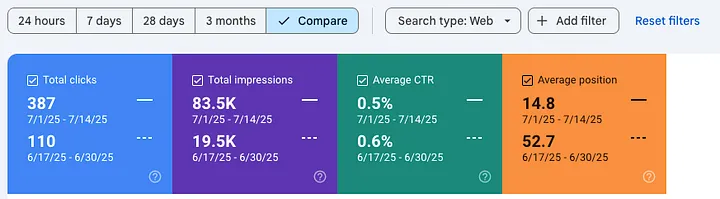
- 1387 clicks in 14 days, against 110.
- 283.5K impressions, against 19.5K.
- 3Average position 14.8, against 52.7.
Now the same three measures, pulled on 9 October 2026 for the latest complete 28 days, 9 Sept to 6 Oct 2026.
Clicks in 28 days
1,869
was 997 in summer 2025
87% more
Impressions in 28 days
338,957
was 231K in summer 2025
about 47% more
Average position
6.7
was 14.3 in summer 2025
7.6 places better
Against the 28 days immediately before (12 Aug to 8 Sept), clicks are up 14%, from 1,640 to 1,869, and average position moved from 10.5 to 6.7. Impressions were roughly flat: 347,335 then, 338,957 now. More clicks from the same number of impressions is what a better position looks like.
One honest caveat. The two snapshots come from different pulls a year apart. The Search Console property we query today has data from 10 December 2025 onwards, so the 2025 figures cannot be pulled again and are shown exactly as they were captured. Read this as two dated snapshots, not a controlled experiment.
The full picture
Ten months, week by week. Dips included.
Two snapshots can hide a lot, so here is everything in between that we can still pull. From 10 December 2025 to 6 October 2026, 301 days, ligosocial.com earned 21,571 clicks from 4,940,489 impressions in Google Search.
Figure 3
ligosocial.com in Google Search, per week
Hover the chart, or focus it and use the arrow keys, to read any week.
Show all 42 weeks as a table
| Week | Clicks | Impressions | Position |
|---|---|---|---|
| 15 Dec to 21 Dec 2025 | 153 | 8,011 | 21.9 |
| 22 Dec to 28 Dec 2025 | 232 | 12,741 | 21.7 |
| 29 Dec to 4 Jan 2026 | 250 | 19,617 | 18.6 |
| 5 Jan to 11 Jan 2026 | 190 | 31,534 | 17.1 |
| 12 Jan to 18 Jan 2026 | 223 | 53,982 | 13.6 |
| 19 Jan to 25 Jan 2026 | 298 | 88,518 | 13.6 |
| 26 Jan to 1 Feb 2026 | 384 | 114,369 | 11.7 |
| 2 Feb to 8 Feb 2026 | 563 | 129,951 | 9.2 |
| 9 Feb to 15 Feb 2026 | 659 | 161,684 | 8.7 |
| 16 Feb to 22 Feb 2026 | 660 | 166,732 | 7.9 |
| 23 Feb to 1 Mar 2026 | 712 | 197,676 | 7.8 |
| 2 Mar to 8 Mar 2026 | 731 | 205,671 | 7.7 |
| 9 Mar to 15 Mar 2026 | 705 | 183,711 | 7.5 |
| 16 Mar to 22 Mar 2026 | 544 | 142,548 | 7.4 |
| 23 Mar to 29 Mar 2026 | 625 | 154,898 | 7.2 |
| 30 Mar to 5 Apr 2026 | 788 | 194,537 | 6.8 |
| 6 Apr to 12 Apr 2026 | 741 | 202,140 | 7.0 |
| 13 Apr to 19 Apr 2026 | 774 | 200,422 | 7.2 |
| 20 Apr to 26 Apr 2026 | 832 | 177,776 | 7.4 |
| 27 Apr to 3 May 2026 | 752 | 187,715 | 8.0 |
| 4 May to 10 May 2026 | 742 | 207,252 | 8.2 |
| 11 May to 17 May 2026 | 778 | 211,203 | 8.3 |
| 18 May to 24 May 2026 | 852 | 184,151 | 8.1 |
| 25 May to 31 May 2026 | 622 | 158,098 | 8.2 |
| 1 Jun to 7 Jun 2026 | 646 | 160,807 | 7.7 |
| 8 Jun to 14 Jun 2026 | 492 | 103,251 | 8.3 |
| 15 Jun to 21 Jun 2026 | 393 | 83,636 | 9.1 |
| 22 Jun to 28 Jun 2026 | 377 | 75,083 | 10.6 |
| 29 Jun to 5 Jul 2026 | 368 | 70,205 | 9.3 |
| 6 Jul to 12 Jul 2026 | 370 | 67,412 | 10.8 |
| 13 Jul to 19 Jul 2026 | 330 | 60,513 | 10.2 |
| 20 Jul to 26 Jul 2026 | 349 | 60,025 | 11.0 |
| 27 Jul to 2 Aug 2026 | 321 | 70,316 | 13.0 |
| 3 Aug to 9 Aug 2026 | 428 | 77,340 | 10.5 |
| 10 Aug to 16 Aug 2026 | 444 | 92,796 | 10.5 |
| 17 Aug to 23 Aug 2026 | 440 | 80,902 | 11.5 |
| 24 Aug to 30 Aug 2026 | 367 | 81,398 | 12.1 |
| 31 Aug to 6 Sep 2026 | 420 | 92,204 | 8.5 |
| 7 Sep to 13 Sep 2026 | 440 | 99,323 | 7.6 |
| 14 Sep to 20 Sep 2026 | 443 | 91,270 | 6.7 |
| 21 Sep to 27 Sep 2026 | 462 | 79,788 | 6.4 |
| 28 Sep to 4 Oct 2026 | 499 | 75,001 | 6.5 |
It is not a straight line, and we would not trust it if it were. Clicks climbed through the spring, and the best 28 days were 23 Apr to 20 May 2026 with 3,179 clicks. The best single day was 19 May 2026, with 171. Then the summer was soft: July brought 1,544 clicks at an average position of 10.8.
Switch the chart to average position to see what the latest passes of the loops line up with. Position went from 11.3 in August to 7 in September, and the latest 28 days are the best the site has recorded. Clicks are following: 1,544 in July, 1,802 in August, 1,960 in September.
Figure 4
Month by month, January to September 2026
| Month | Clicks | Impressions | Position |
|---|---|---|---|
| January 2026 | 1,155 | 282,024 | 13.5 |
| February 2026 | 2,566 | 649,232 | 8.5 |
| March 2026 | 2,935 | 777,567 | 7.4 |
| April 2026 | 3,379 | 823,376 | 7.2 |
| May 2026 | 3,244 | 832,845 | 8.2 |
| June 2026 | 2,044 | 447,141 | 8.7 |
| July 2026 | 1,544 | 287,724 | 10.8 |
| August 2026 | 1,802 | 362,555 | 11.3 |
| September 2026 | 1,960 | 389,940 | 7.0 |
How we run it
We do not open a dashboard. We ask Claude.
LigoSocial's Search Console is connected to Murkuz once. After that the work happens inside Claude. Murkuz hands Claude the real rows for the site, with the window and the source attached, and Claude does the reading: which queries, which pages, what changed, what to do next. We draft the articles and the edits in the same conversation.
The drafts then go into the Murkuz CMS, which renders LigoSocial's blog. On 9 October 2026 it held 280 published articles for the site. That part of Murkuz is an add-on we enable on request, and it is covered further down. The loops themselves need only the connector.
Figure 5
From Search Console row to published article, and back
Source
Google Search Console
Clicks, impressions and positions for every LigoSocial page and query.
Connector
Murkuz
Hands those rows to the agent: filtered, sorted, paginated and sourced.
Agent
Claude
Runs the three loops, decides what to write or change, and drafts it.
Add-on, on request
Murkuz CMS
Holds the drafts and renders the published articles on the blog.
Result
The live blog
The article goes live on ligosocial.com/blog and starts collecting impressions.
Two to four weeks later the new rows are in Search Console, and the next pass of the loops starts from them.
The method
Three loops, repeated every two to four weeks.
There is no single trick here. There are three questions, asked again and again of fresh data. Each one is a loop because the answer changes after you act on it: publish the article, merge the pages or tighten the paragraph, wait for Search Console to catch up, then ask again.
Figure 6
The three loops as one cycle
- 01New articlesWhich searches do we get impressions for, or could we, with no page that answers them properly?
Search_AnalyticsKeyword_IdeasCompetitor_Gap - 02CannibalisationWhere are two or more of our own pages competing for the same search and splitting the result?
Live_Cannibalization - 03Easy wins on top pagesWhich queries does a strong page already rank for, and which of those is it weakest on?
Live_Quick_WinsSearch_Analytics
Repeat every 2 to 4 weeks
01New articles
The first loop looks for searches we have no proper answer to. Claude reads the queries LigoSocial already gets impressions for, finds the ones where no page addresses the search directly, and widens each into its neighbouring terms. The output is a short list of articles worth writing, each with a target query and the questions it has to answer.
We then draft those articles in the same conversation and publish them through the Murkuz CMS. The three most recent went live on 8 October 2026, the day before this page was rewritten.
Figure 7
The latest pass of loop 1: three new articles
- LinkedIn Advanced Search: Post Filters and URL Parameters2,613 words
- LinkedIn Boolean Search: 20 Copyable Strings by Use Case3,230 words
- LinkedIn Lists: Build Prospect Lists and Work Them Daily2,514 words
02Content cannibalisation
Publish steadily for long enough and your own pages start competing with each other. Google has to choose between them for one search, and often ranks none of them as well as it would rank one clear page. The second loop finds those collisions.
On 9 October 2026 the connector found 105 queries where two or more LigoSocial pages appeared for the same search in the last 28 days (queries with at least 50 combined impressions). Here is one of them, exactly as returned.
Figure 8
One query, five of our own pages: "best time to post on linkedin"
- /blog/best-time-to-post-on-linkedin-b2b-company-pages-in-2025665 impr. · pos. 7.4
- /blog/why-most-linkedin-best-time-to-post-advice-is-wrong407 impr. · pos. 6.2
- /blog/best-days-and-times-to-post-on-linkedin-for-maximum-engagement-by-industry75 impr. · pos. 53.0
- /research/best-time-to-post-on-linkedin-company-page1 impr. · pos. 5.0
- /blog/best-time-to-post-on-linkedin-for-each-industry-data-backed-analysis1 impr. · pos. 8.0
Five pages, 1,149 impressions, no clicks. Two of the pages carry almost all of the impressions and sit at positions 6 and 7, close enough to trade places. The fix is a decision, and Claude proposes it with the rows in front of it: pick the page that should own the search, fold the best of the others into it, redirect what is left, and point the internal links at the winner. This one is on the list for the next pass, which is the point of showing it. The loop does not run out of work.
03Easy wins on top pages
The third loop is the cheapest and usually the fastest to pay back. Take a page that already ranks, list every query it ranks for, and look for the ones it is weak on. A page that sits first for ten phrasings of a question and fifth for the eleventh does not need a rewrite. It needs that eleventh phrasing worked in.
Here is a real one. Over the last 28 days this page earned 108 clicks from 19,993 impressions at an average position of 2.5:
/blog/how-to-add-links-to-linkedin-posts-and-make-them-stand-out
Figure 9
Reverse-engineering one page: where it ranks for each query
- how to add a link to a linkedin postpos. 1.41.4
- how to hyperlink in linkedin postpos. 2.22.2
- how to add link to linkedin postpos. 1.51.5
- can you hyperlink in linkedin postpos. 1.01.0
- how to add a link to linkedin postpos. 2.32.3
- how to add link in linkedin postpos. 1.91.9
- hyperlink in linkedin postpos. 1.21.2
- add link to linkedin postpos. 4.44.4
Seven of the eight sit between position 1.0 and 2.3. One does not: “add link to linkedin post”, the short imperative form, is at 4.4. That is the weak one. The edit is small: use that exact phrasing in a subheading and answer it in the first sentence under it. Then leave the rest of the page alone, because the rest of the page is working.
The same loop also runs across the whole site. The connector found 95 queries sitting at position 15 or better with at least 100 impressions in 28 days. These are the six with the most impressions.
Figure 10
Queries close enough to move
| Query | Impressions | Clicks | Position |
|---|---|---|---|
| how much is linkedin premium | 1,364 | 3 | 4.5 |
| best time to post on linkedin | 1,131 | 0 | 9.8 |
| linkedin premium price | 1,072 | 0 | 7.6 |
| linkedin post preview | 1,049 | 13 | 9.5 |
| how to open linkedin company account | 894 | 0 | 8.8 |
| linkedin bold text | 791 | 1 | 9.0 |
For context, these are the pages doing most of the work right now. Every one of them is on page one on average.
Figure 11
LigoSocial's top pages by clicks, last 28 days
- /blog/how-to-reply-to-congratulations-on-linkedin-professional-templates-and-best-practices
156 clicks · 20,412 impressions · position 5.9
- /blog/linkedin-comment-examples-professional-responses-for-every-situation
151 clicks · 6,911 impressions · position 4.7
- /tools/linkedin-comment-generator
148 clicks · 2,255 impressions · position 5.6
- /blog/how-to-find-your-linkedin-username-a-complete-guide-2025
119 clicks · 29,276 impressions · position 4.9
- /blog/how-to-add-links-to-linkedin-posts-and-make-them-stand-out
108 clicks · 19,993 impressions · position 2.5
- /blog/10-linkedin-text-formatting-tricks-to-make-your-posts-stand-out
104 clicks · 14,884 impressions · position 6.6
Automate it
You do not need us in the room. You need the prompt.
None of this depends on a person remembering to do it. Murkuz gives you the skill file for it: a prompt that Claude runs as a loop of its own, on your machine or wherever you run your agents. Connect your sites, hand Claude the prompt, and it works through all three loops and comes back with one prioritised list.
Here is a starter version you can paste into Claude today, with the Murkuz connector attached.
You have the Murkuz connector. Work on one site: <your site>.
Use the last 28 days unless I say otherwise, and state the window and the
property with every number you report.

Loop 1, new articles
- Call Search_Analytics by query, sorted by impressions. List queries with
  real impressions where no page of ours answers the search directly.
- For the strongest five, call Keyword_Ideas to find the neighbouring terms.
- Propose one article per gap: working title, target query, the questions it
  must answer, and the existing pages it should link to.

Loop 2, cannibalisation
- Call Live_Cannibalization. For each query where two or more of our pages
  compete, name the page that should own it and say what to do with the
  others: merge, redirect, or re-angle towards a different query.

Loop 3, easy wins on top pages
- Call Search_Analytics by page, sorted by clicks, and take the top ten.
- For each, call Search_Analytics by query filtered to that page. Find the
  queries where it ranks clearly worse than its own average.
- Say exactly where to work each weak query in: a heading, an answer near the
  top, or a new section. Do not rewrite what already ranks.
- Call Live_Quick_Wins for queries just off the top three, and add those.

Finish with one prioritised list of changes, biggest expected gain first.
Do not invent a number. If a tool returns nothing, say so.
Run this again in two to four weeks and compare against today.
Every tool it names is in the connector tool reference. Reading your own Search Console data is never metered. Keyword_Ideas is the one research call in the prompt, and it uses research credits.
Add-on, on request
Publishing your blog through Murkuz
LigoSocial's articles are uploaded to Murkuz and rendered on its blog by Murkuz, and each one is audited and optimised on the way. That keeps the writing, the publishing and the measuring in one place, which is why the loops above are quick for us to act on.
This is not a self-serve feature and you will not find it in the app after signing up. It is available on request as an add-on. If you want your blog published through Murkuz, contact support and we will enable it for your account.
Method and limits
What these numbers are, and what they are not
- Source. Google Search Console for ligosocial.com, web search, read through the Murkuz connector on 9 October 2026. Bing is not included in any figure on this page.
- Windows. “Now” is 9 Sept to 6 Oct 2026, the latest complete 28 days on the pull date. The weekly chart uses complete Monday to Sunday weeks. The loop examples use the connector's last-28-days window on the pull date.
- The 2025 figures. Read off two Search Console screenshots from the original case study and shown unaltered. The property we query today starts on 10 December 2025, so we cannot pull them again.
- Average position. Weighted by impressions across every query, device and country. It is not a rank-tracker rank, so read changes in it rather than the absolute number.
- No causal claim. There was no control group. Search demand, Google updates and seasonality all moved during this period, and the summer dip in the chart is part of the record.
- First party. LigoSocial is built by the same team as Murkuz. We are our own customer here.
FAQ
Questions about this case study
Is LigoSocial a Murkuz customer?
LigoSocial is built by the same team that builds Murkuz, so this is a first-party case study. We use Murkuz on LigoSocial exactly as a customer would: Search Console connected once, questions asked from inside Claude.
Where do the numbers come from?
Every 2026 number is Google Search Console data for ligosocial.com, web search, read through the Murkuz connector on 9 October 2026. The 2025 numbers are read off Search Console screenshots taken for the original version of this case study and are shown as captured.
Did Murkuz cause the growth?
We cannot prove that, and we do not claim it. There was no control group. What we can say is that these are the loops we ran, through Murkuz, over the period the chart covers, and that the chart is the real result, dips included.
How often should you run an SEO loop like this?
We repeat all three loops every two to four weeks. Search Console data needs a couple of weeks to settle after a change, so running them more often mostly measures noise.
Can Murkuz publish my blog as well?
Yes, on request. Murkuz includes a CMS that can hold your articles and render your blog, with each article audited and optimised. It is not a self-serve feature: contact support and we will enable it for your account as an add-on.
Do I need the CMS add-on to run the three loops?
No. The loops only need the connector and your Search Console data. Claude tells you what to write and what to change, and you publish in whatever CMS you already use.
Want the wider data? Our study of 633 new articles shows how long a new page takes to reach page one, and the keyword cannibalisation guide covers loop 2 in depth.