How much of the total is missing from the query report?
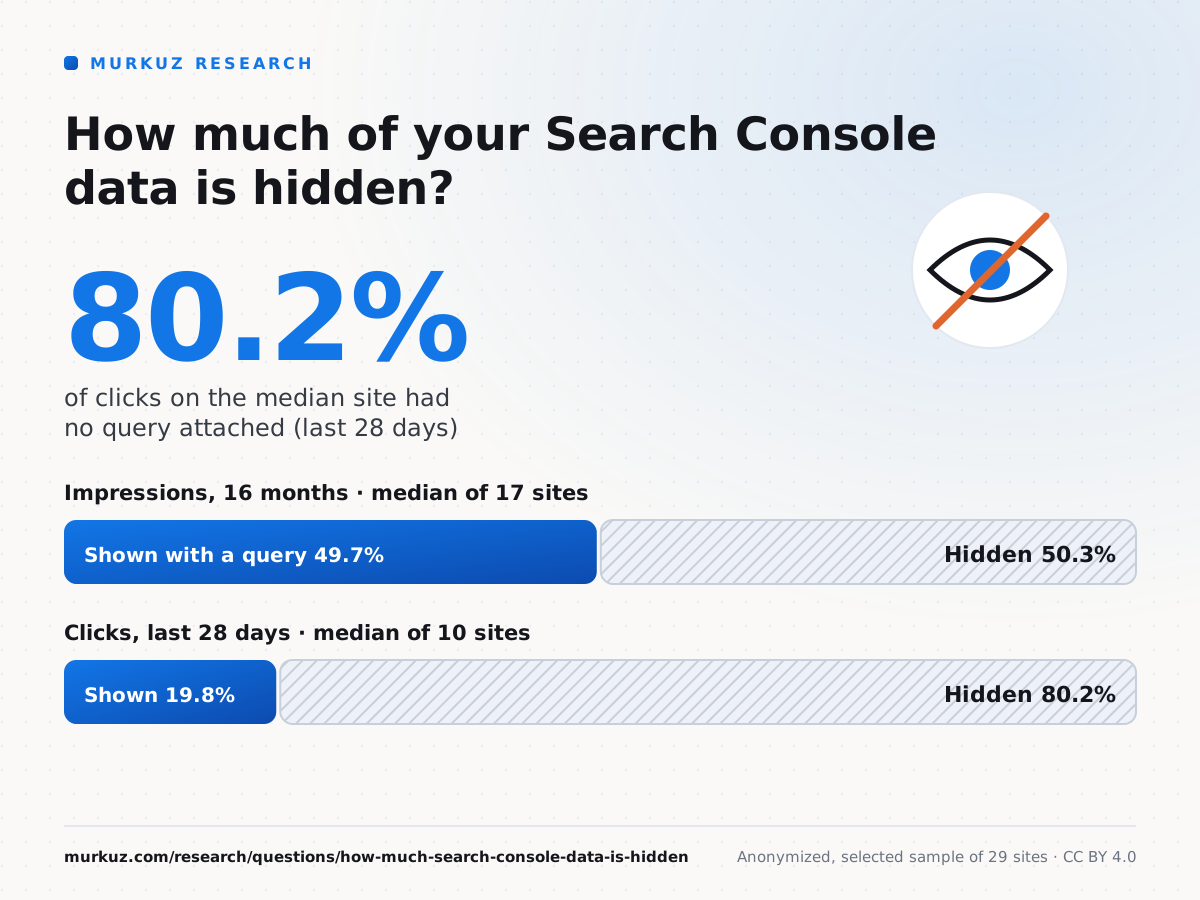
About half of impressions, and most clicks. We compared each site's property total with the sum of its query rows. Over 16 months the median site had 50.3% of its impressions without a query (middle half of sites: 33.1% to 72.5%).
Clicks were hidden even more. Over the last 28 days, the median site had 80.2% of its clicks without a query (middle half: 47.5% to 89.7%). On a site that gets a few dozen clicks a week, most of them come from searches typed so rarely that Google keeps them out of the report.
Share of Search Console totals not attributed to any query
Why does Search Console hide queries?
Google leaves out queries that very few people searched, to protect the privacy of the person searching. Its documentation calls these anonymized queries. The site total still counts them, so the query table never adds up to the chart above it.
The long tail you can see shows how close to the line most queries sit. On the median site, 41.5% of the queries that did appear had a single impression. Everything just below that threshold is in the hidden share.
What does the visible part of the report show?
Mostly your head terms. On the median site, the 10 queries with the most clicks took 80.5% of all query-level clicks (middle half: 49.5% to 89.2%).
Put the two together and the picture is lopsided. The report shows the handful of searches that bring visible clicks, while a large share of real clicks comes from searches that are never listed. Pages, countries and devices are still reported in full, so use those views to measure traffic and keep the query table for finding topics.
What the visible query list looks like on the median site
What to do about it
Measure traffic by page, not by query
Page-level totals include the anonymized searches. Report growth from the Pages tab and use queries to explain it.
Work out your own hidden share
Divide the query rows by the total and you know how much of the story the query table leaves out.
Hidden share formulaSearch Console > Performance, same date range for both: A = total clicks shown on the chart B = sum of clicks in the Queries table export Hidden share of clicks = (A - B) / A Repeat with impressions. Use the API or a connector: the UI export stops at 1,000 rows.Pull every row through the API
The Search Console interface stops at 1,000 rows. The API returns far more of the long tail, which shrinks the part you cannot see from the part that is truly anonymized.
Find hidden topics from the page side
A page with clicks but few visible queries is ranking for long, rare searches. Read the page and the visible queries together to guess the rest, then write sections that answer them.
Check this on your own site
Murkuz connects Google Search Console, GA4 and Bing Webmaster Tools to Claude or ChatGPT, so you can ask the same questions about every site you run and get answers from your real rows. Paste any of these into the chat:
What share of my clicks in the last 28 days is not attributed to any query?Which of my pages have the most clicks but the fewest visible queries?List all queries for [URL] with one or two impressions in the last 90 days.
- Google Search Console MCPEvery query row the API returns, paginated, for every site you run.
- Keyword Clustering ToolGroup the long-tail queries you can see into topics.
- Murkuz MCP toolsPull your raw Search Console numbers from inside Claude or ChatGPT.
- Every MCP toolThe full list of questions the connector can answer, with what each one reads.
More free utilities on the tools page.
Methodology
We selected 29 sites for this analysis. Selection criteria: small and mid-sized software, SaaS, review and content sites with Google Search Console data for the whole study window. Their data is anonymized.
We selected 17 sites for this analysis. Selection criteria: a Google Search Console property with 16 months of data whose query rows were not cut off by the API row cap.
For each site we compared the property total from Google Search Console (web search) with the sum of every query row the Search Console API returned for the same dates. The hidden share is the part of the total with no query attached.
Impressions are measured over 16 months to 22 October 2026. Clicks are measured over the last 28 days, for the sites with enough clicks to measure. We report the median site and the middle half of sites (25th to 75th percentile), never a pooled figure, so one large site cannot set the result.
Single-impression share is the share of visible queries with exactly one impression over 16 months, measured on the 19 sites with at least 1,000 impressions. Top-10 share is the share of query-level clicks that went to each site's 10 most-clicked queries over 16 months, measured on the 10 sites with at least 100 clicks.
Sites are never named or described in a way that identifies them. We only publish a comparison when each group holds at least five sites. Data snapshot: 22 October 2026.
| Finding | Sites |
|---|---|
| Hidden share of impressions, 16 months | 17 |
| Hidden share of clicks, 28 days | 10 |
| Single-impression share of visible queries, 16 months | 19 |
| Top-10 query share of clicks, 16 months | 10 |
You can reuse the numbers, charts and infographic under CC BY 4.0: credit Murkuz and link to this page. Spotted an error? Email [email protected] and we will correct it and note the change.
Frequently asked questions
Why don't my Search Console queries add up to the total?
Because Google leaves rare queries out of the query report but keeps them in the total. On the median site in our data, 50.3% of impressions and 80.2% of clicks had no query attached.
What are anonymized queries in Search Console?
They are searches made by very few people, which Google removes from query-level reports to protect searchers' privacy. They still count in the site, page, country and device totals.
How much Search Console data is missing?
It varies a lot by site. For impressions over 16 months, the middle half of sites in our study had 33.1% to 72.5% hidden. For clicks over 28 days, 47.5% to 89.7%.
Does the Search Console API show hidden queries?
It shows many more rows than the 1,000-row limit in the interface, but it does not show anonymized queries. Those are left out of every query-level report.
Can I see hidden queries in Google Analytics?
No. Google Analytics reports organic search sessions but not the query behind them. The Search Console link in GA4 shows the same query data as Search Console itself.

About the author
Junaid K., SEO Specialist
I run SEO for 14 sites across eight products: 3,600+ published articles, 50M+ organic search impressions, and organic search as the first growth channel for every launch. Day to day that means Search Console and GA4 analysis, keyword and SERP research, content operations at scale, and catching ranking decay before it costs traffic. These articles are the notes from that work.