Most SEO report templates are a list of metric boxes with no instructions for what to say about them. You end up with a PDF full of numbers and a client asking "so is this good or bad?" on the call anyway.
This is a seo report template built the other way around: every section exists to answer a specific question someone is actually going to ask, whether that's a client checking on their retainer or your own team checking on a page you promised to fix. Copy the structure below, fill it with your own numbers, and you will have a report that reads like an explanation instead of an export.
What an SEO report template actually needs to do
An SEO report has exactly one job: prove that the work is producing results, or show clearly why it isn't yet. Everything in the template below exists in service of that one job. If a section doesn't help answer "is this working," cut it.
That means a good template has to do three things at once:
- Show the trend, not just the snapshot (a single month of data tells you almost nothing on its own).
- Connect ranking movement to something the reader cares about: traffic, leads, revenue, not just position numbers.
- Say, in plain language, what you are doing next and why.
Most templates you'll find online are dashboard screenshots with widget names. They're fine for internal monitoring. They fall apart the moment a client or a stakeholder who isn't fluent in SEO opens the file and has to guess what "impressions" or "average position" means for their business.
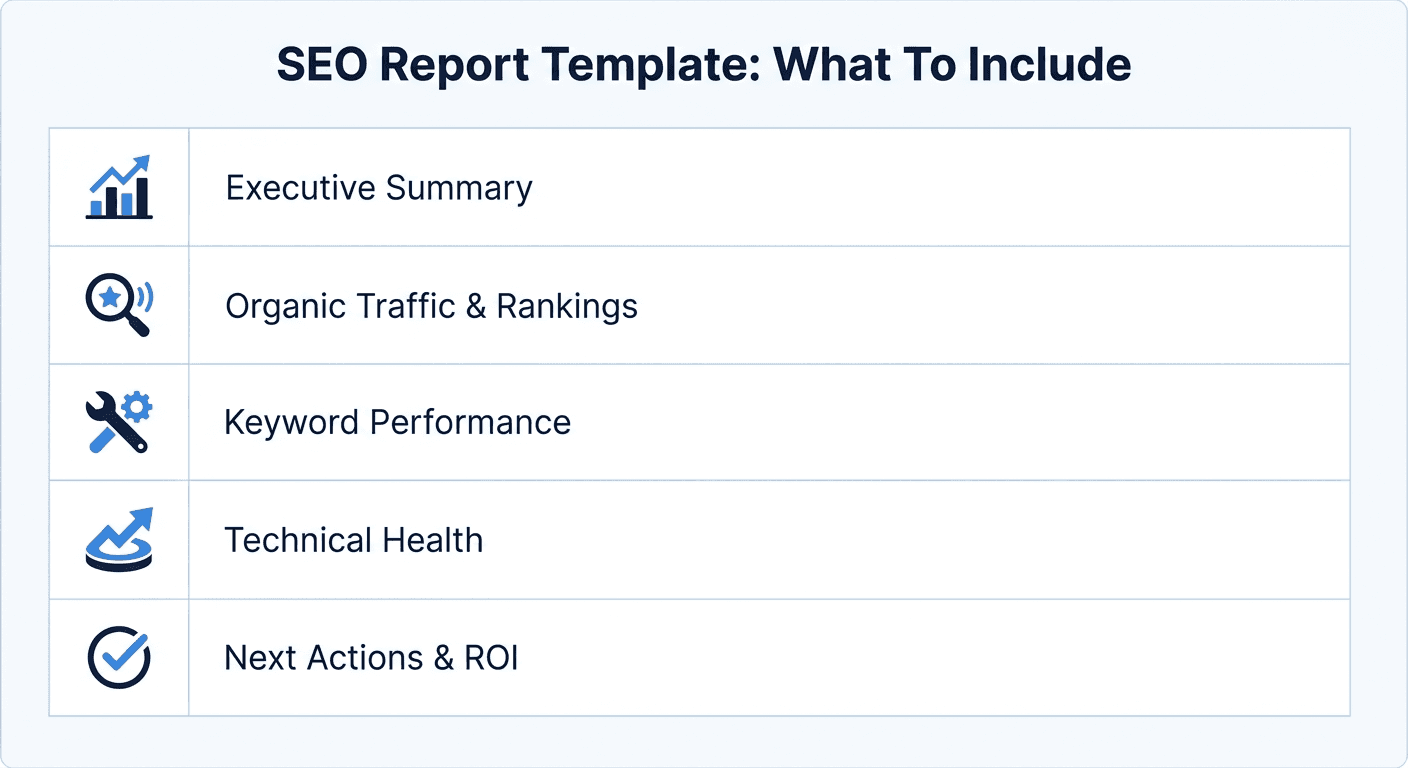
The seo report template, section by section
Here is the structure. Use all six sections for a client report; internal teams can usually skip the summary narrative and jump straight to the data (more on that split below).
1. Executive summary (3-5 sentences, always first)
This is the only part guaranteed to get read in full. Write it last, after you've looked at the data, and answer three questions directly:
- What happened this period (up, down, flat, and by how much)?
- What caused it (a specific fix, a Google update, seasonality, a competitor move)?
- What are you doing next?
Example: "Organic traffic grew 18% month over month after we rewrote the /pricing page and fixed three pages that had dropped out of the top 10. Two pages are still declining and are queued for a content refresh next week."
2. Organic traffic and rankings trend
A line or bar chart covering at minimum the trailing 3 months, ideally 6 to 12 for context. Include:
- Organic sessions or clicks (from Google Search Console or GA4)
- Average position for the 10-20 keywords that matter most, not every keyword you track
- Impressions, so a ranking gain that hasn't yet translated into clicks still shows up as progress
Skip the 90-day-only view if you can help it. A single quarter can look like a crisis or a miracle depending on what happened the quarter before it; a longer trend line prevents both false alarms and false confidence.
3. Keyword performance (winners, losers, and near-misses)
A simple table beats a wall of keyword rows. Three groups, five to ten keywords each:
| Group | What to include | Why it matters |
|---|---|---|
| Winners | Keywords that gained positions or entered the top 10 | Shows the work is landing |
| Losers | Keywords that dropped, especially off page 1 | Where content decay is happening right now |
| Near-misses | Keywords sitting at positions 11-20 | The cheapest wins available: a small on-page fix can push these onto page 1 |
The near-misses row is the one almost every template skips, and it's usually the most actionable line in the whole report. Positions 11 through 20 are pages that are already relevant enough to rank, just not optimized enough to break through. A single internal link, a title rewrite, or a stronger H1 often moves one of these into the top 10 faster than any new content would.
4. Technical and content health
A short checklist, not a full audit dump: crawl errors, Core Web Vitals status, any pages that lost significant traffic (the plain-English term for this is content decay, when a page that used to rank well quietly slides down as it goes stale), and broken or redirected pages discovered since the last report. If nothing needs attention, say so in one line instead of leaving the section blank, which reads as "we didn't check."
5. What we did and what's next
A short, dated list. Two columns work well: "Completed this period" and "Planned next period." This is the section that turns a report into an accountability document instead of a data dump, and it's the single easiest addition that makes a report feel trustworthy.
6. ROI and business impact (the section that closes the loop)
This is where most templates stop short. Ranking and traffic charts prove activity; they don't prove value. Whenever you can, connect the SEO metrics to something the reader already tracks: leads, signups, revenue, or at minimum engaged sessions and conversion rate from pages you've worked on. Pulling Google Search Console ranking data next to Google Analytics traffic and conversion data is what actually answers the question "was this worth it," and it's the difference between a report that gets skimmed and one that gets forwarded to a CFO.
A worked example (so you can see it filled in)
Here's a condensed version of what section 1 and section 6 might look like for a real client, a mid-size ecommerce store, after one month of work:
Organic sessions rose from 8,400 to 9,650 (+14.9%) in March, driven mainly by a content refresh on three category pages that had lost rankings since January. Two of those pages moved from position 14 to position 7, and one moved from position 22 to position 9. Organic revenue for the month was $11,200, up from $9,300, a 20.4% increase, slightly ahead of the traffic growth because the recovered pages carry a stronger buyer intent than the site average.
Notice what makes that paragraph useful: it names the specific pages, the specific position movement, and ties the traffic increase to a revenue number instead of stopping at "traffic is up." That's the template doing its actual job.
Client reports vs internal reports: what actually changes
Most guides treat "SEO report" as one format. It isn't. The audience changes what belongs in the report.
Client reports need the executive summary, the plain-language technical health section, and the ROI section, because the reader is often not an SEO practitioner and is deciding whether to keep paying for the work. If you want a fuller breakdown of what a client-facing report specifically needs and how often to send one, see our guide on building a client SEO report.
Internal reports can drop the summary narrative most weeks and go straight to the keyword table and the technical checklist, because the reader already knows the account and just needs the current numbers to decide what to prioritize. If your team is reporting weekly instead of monthly, a live dashboard usually serves that need better than a static document. Our piece on setting up an SEO reporting dashboard covers how to build that view once and stop re-exporting the same charts every week.
The one thing both formats share: they should show a trend, not a snapshot, and they should end with a "what's next," not just a "what happened."
Report format: what to actually build it in
- Google Slides or PowerPoint works well for client reports because it forces you to summarize instead of dumping raw tables, and it's easy to present live on a call.
- Google Sheets or Excel suits internal reporting where the team wants to filter, sort, or pull a specific keyword's history without reading a narrative.
- A live dashboard (Looker Studio or a purpose-built tool) is the right call once you're reporting weekly or across more than a handful of clients, since manually rebuilding slides every week is the first thing that gets skipped when the team gets busy.
Whichever format you pick, the six sections above stay the same. The format is just the container.
How often to send an SEO report
Monthly is the standard cadence for most client relationships and most internal stakeholders, because SEO moves slowly enough that weekly reports mostly repeat the same numbers with more noise. Two situations call for more frequent reporting: the first 90 days of a new engagement, when stakeholders want reassurance the work has started, and any period right after a major algorithm update or a large site change, when someone is going to ask what happened regardless of the usual schedule.
FAQ
What should an SEO report include at minimum?
Organic traffic trend, keyword ranking movement (winners, losers, and near-misses at positions 11-20), a short technical health check, and a plain-language summary of what happened and what's next. Revenue or conversion data if you have access to it.
What's the difference between an SEO report and an SEO audit?
A report tracks ongoing performance over time on a recurring schedule. An audit is a one-time (or periodic) deep technical and content review that identifies problems to fix. A report might reference audit findings, but they're different documents with different purposes.
How do I make an SEO report for a client who isn't technical?
Lead with the executive summary in plain language, avoid jargon like "impressions" or "SERP" without a one-line explanation, and always connect metrics back to something they already care about, like leads or revenue, rather than leaving them to interpret a position number on their own.
Should I use a free SEO report template or build my own?
A free template is a fine starting point for the layout, but most free templates (from dashboard tool vendors) are built to show off that tool's widgets rather than to communicate clearly. Use the section structure in this guide as the actual template, and adapt the visuals to whatever tool you already pull data from.
How do I show ROI in an SEO report?
Pair your ranking and traffic data with conversion or revenue data from Google Analytics, even a rough estimate is better than none. The goal is a sentence like "this page's traffic increase produced $X in additional revenue," not just a chart of positions.
Closing the loop on reporting
A report is a snapshot of work that already happened. The harder problem is catching the pages that need that work before a client has to ask why traffic dropped. That's the gap most SEO tools leave open: they'll show you the decay in next month's report, three or four weeks after it started costing you traffic.
I'm Junaid Khalid, founder of Ertiqah and the builder behind Murkuz. I've run SEO as the first growth channel across five of my own SaaS products, and the recurring headache was never writing the report, it was not knowing a page had started slipping until the monthly numbers already showed it. Murkuz detects that decay as it happens, helps you fix the page, and then feeds the recovery straight into the same kind of report this guide walks through, so "what's next" turns into "here's what we already did."